12-month Returns Simulation
While we expect volatility consistent with a largely equities portfolio, we manage our portfolio to deliver sustainable returns over the long term.
Jump to
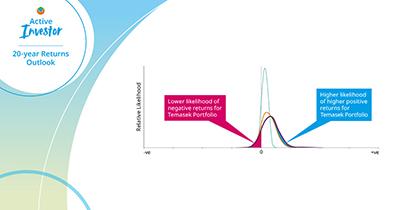
For our current portfolio mix, our Monte Carlo simulations show a five-in-six chance that one-year forward portfolio returns may range from -16% to +30%. Our annual returns ranged from -30% to +46%, over the past 20 years.
Narrower curves in the chart below mean less volatility compared, for instance, to the flatter curves of the 2008/09 Global Financial Crisis (GFC) years.
(as at 31 March)
Simulation of 12-month Forward Portfolio Returns
Volatility of Returns
A wider simulated range means a more volatile outlook.
The range of possible returns from the simulation is dependent on the prevailing volatility and correlation conditions of asset markets. When prevailing volatility is high, such as at the onset of the COVID-19 pandemic or during the GFC years, the wider range of one-year simulated forward returns signals greater probability of larger gains and losses.


